20 Disturbing Water Facts That Put the Crisis in Context
Water looks limitless when you are staring at an ocean, a rainstorm, or even a running hotel faucet. The disturbing truth is that safe, reliable water is deeply unequal: billions of people still lack it at home, freshwater systems are being pushed beyond recovery, and pollution can remain invisible until it reaches a test result.
The most disturbing water facts at a glance
The household access figures below use WHO and UNICEF estimates for 2024. Older research is labeled with its study period so you can distinguish historical resource modeling from recent household data.
- 2.1 billion people lack safely managed drinking water at home.
- 106 million people drink directly from untreated surface water.
- 3.4 billion people lack safely managed sanitation.
- 1.7 billion people lack basic hygiene services at home.
- About 4 billion people experience severe water scarcity for at least one month each year.
- Women and girls spend an estimated 250 million hours collecting water every day.
- Agriculture accounts for 72% of global freshwater withdrawals.
- More than half of the world’s large lakes have lost water since the early 1990s.
Those numbers deserve more than a gasp and a share button. Here is what they actually mean, where the data has limits, and why the crisis is about access, infrastructure, pollution, ecosystems, and power as much as the amount of water on Earth.
1. One in four people lacks safely managed drinking water
In 2024, 2.1 billion people did not have drinking water that met the United Nations definition of safely managed. That means an improved source located on the premises, available when needed, and free from fecal and priority chemical contamination.
The latest WHO and UNICEF household update also shows real progress, with 961 million people gaining safely managed service between 2015 and 2024. The disturbing part is not that nothing has improved, but that progress remains far too slow and uneven.
2. More than 100 million people still drink surface water
About 106 million people drink directly from rivers, lakes, ponds, canals, or irrigation channels. “Surface water” sounds almost peaceful until you remember that the same source may receive animal waste, runoff, sewage, sediment, and chemicals.
This number does not include everyone whose improved source is unreliable or contaminated. It is the lowest rung on the drinking-water service ladder, not the full population facing unsafe water.
3. A water source can be “improved” without being safely managed
A protected well, borehole, public tap, piped supply, or packaged water can count as an improved source. It only reaches the safely managed level when it is accessible at home, available when needed, and meets water-quality standards.
That distinction explains why two water statistics can look contradictory. One may measure the type of source, while another asks whether safe water is consistently available where a household actually needs it.
4. More than 3 billion people lack safely managed sanitation
In 2024, 3.4 billion people lacked sanitation in which human waste was safely contained, removed, or treated. A toilet alone is not enough if its waste leaks into soil, drains, rivers, or groundwater.
The sanitation chain has several places to fail, from containment and emptying to transport and treatment. The flush can make waste disappear from sight without making it disappear from the environment.

5. Hundreds of millions still practice open defecation
WHO and UNICEF estimate that 354 million people practiced open defecation in 2024. This is a matter of safety and dignity as well as public health, especially for women, girls, disabled people, older adults, and anyone who must find a private place after dark.
The global total has fallen substantially since 2015, so the trend is not hopeless. Still, hundreds of millions of people being left without a basic private facility should never feel normal.
6. Handwashing is not possible everywhere
About 1.7 billion people lacked a basic hygiene service at home in 2024, meaning a handwashing facility with soap and water. Of those, 611 million had no handwashing facility at all.
“Wash your hands” is easy advice from a sink with reliable plumbing. It becomes a daily logistical problem when water must be carried, rationed, purchased, or saved for drinking and cooking.
7. The water burden follows existing inequality
People in the least developed countries are more than twice as likely to lack basic drinking water and sanitation as people elsewhere, and more than three times as likely to lack basic hygiene. Safely managed drinking-water coverage in fragile settings trails other countries by 38 percentage points.
Rural areas, informal settlements, Indigenous communities, minority groups, displaced people, and low-income households can all face gaps hidden by a national average. A country showing high coverage may still contain neighborhoods where the tap is unsafe, intermittent, unaffordable, or absent.
8. Women and girls lose 250 million hours a day collecting water
The United Nations World Water Development Report 2026 estimates that women and girls spend 250 million hours every day collecting water. That time comes out of school, paid work, rest, caregiving, and ordinary freedom.
Collection can also involve heavy loads, long walks, heat, unsafe routes, and exposure to harassment or violence. A closer water point is not a minor convenience; it can reorganize an entire day.
9. Four billion people face severe water scarcity seasonally
A study published in 2016, modeling an average year in 1996 to 2005, estimated that 4 billion people experienced severe water scarcity for at least one month annually. Its roughly two-thirds population share describes that historical model, not the share of people affected today.
The finding still helps explain why an annual average can hide a difficult dry season. It measures pressure on water resources, which is a different question from whether a household currently has safe drinking water.
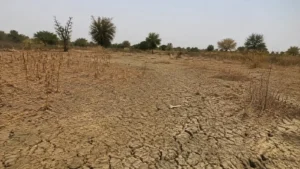
Scarcity is not simply “a desert problem.” Demand can exceed renewable supply, infrastructure can fail to move or store water, pollution can make water unusable, and institutions can distribute what remains unfairly.
10. Some water systems are no longer bouncing back
A 2026 United Nations University report uses the phrase “global water bankruptcy” for basins and aquifers that have been pushed beyond temporary crisis. Long-term overuse, pollution, ecosystem loss, and climate disruption can leave them unable to return to their old conditions.
The phrase is intentionally blunt, but it does not mean every river or well is doomed. It means that waiting for the next rainy year is no longer a serious plan in places where the underlying water account has already been depleted.
11. More than half of large lakes are losing water
The same 2026 assessment reports that more than half of the world’s large lakes have lost water since the early 1990s. Around one-quarter of the global population depends directly on those lakes for water security.
A shrinking lake can concentrate pollutants, damage fisheries, expose dusty lakebed, reduce wildlife habitat, and intensify competition among farms, cities, industries, and ecosystems. The shoreline moving away is only the most visible symptom.
12. Pumping groundwater can make land sink
Aquifers are often treated like invisible emergency savings, but extraction can exceed replenishment for years. When underground sediments compact as water is removed, the land above can subside and some of the lost storage space may never return.
Subsidence can damage roads, buildings, canals, and pipes while making coastal and river flooding worse. In other words, pumping water to solve today’s shortage can physically lower the ground beneath tomorrow’s city.
13. Food production dominates freshwater withdrawals
Agriculture accounts for 72% of global freshwater withdrawals, far more than municipal use. That water grows food, supports rural livelihoods, and makes modern cities possible, so “farmers use too much” is not a useful conclusion.
The real questions are which crops grow where, how efficiently irrigation works, what diets and supply chains demand, and whether rivers and aquifers retain enough water to function. Water policy and food policy are inseparable.
14. Climate change makes water less predictable
A warmer climate intensifies parts of the water cycle, bringing heavier rainfall in some events, longer or sharper drought in some regions, earlier snowmelt, glacier loss, warmer water, and rising seas. More rain in a year does not guarantee more clean water at the time and place people need it.
Floods can overwhelm sewers and contaminate wells, while drought can concentrate pollution and increase demand. My look at the countries most affected by climate change explains why exposure and the ability to adapt matter as much as the hazard itself.
15. Plastic does not stay where we throw it away
NOAA describes plastic as the most prevalent marine debris in the ocean and Great Lakes, arriving through littering, poor waste management, stormwater, fishing activity, and dumping. Its ocean pollution overview covers debris ranging from lost fishing gear to microplastics smaller than 0.2 inch.
Plastic does not simply dissolve into harmless nothing. Sunlight, waves, and abrasion break larger items into smaller fragments that become harder to remove and easier for wildlife to ingest.
16. The ocean’s plastic total is harder to measure than viral posts suggest
You may have seen a precise claim about the number of plastic pieces or the size of a “trash island.” In reality, plastic moves through shorelines, surface water, the water column, sea ice, animals, and seafloor sediment, so no one can simply count it all.
NOAA cites a scientific estimate that roughly 8 million metric tons entered the ocean in 2010, not a measurement repeated every year. Dates and methods matter, especially when a memorable statistic keeps circulating long after its original study.
17. Half of assessed U.S. lakes had poor phosphorus conditions
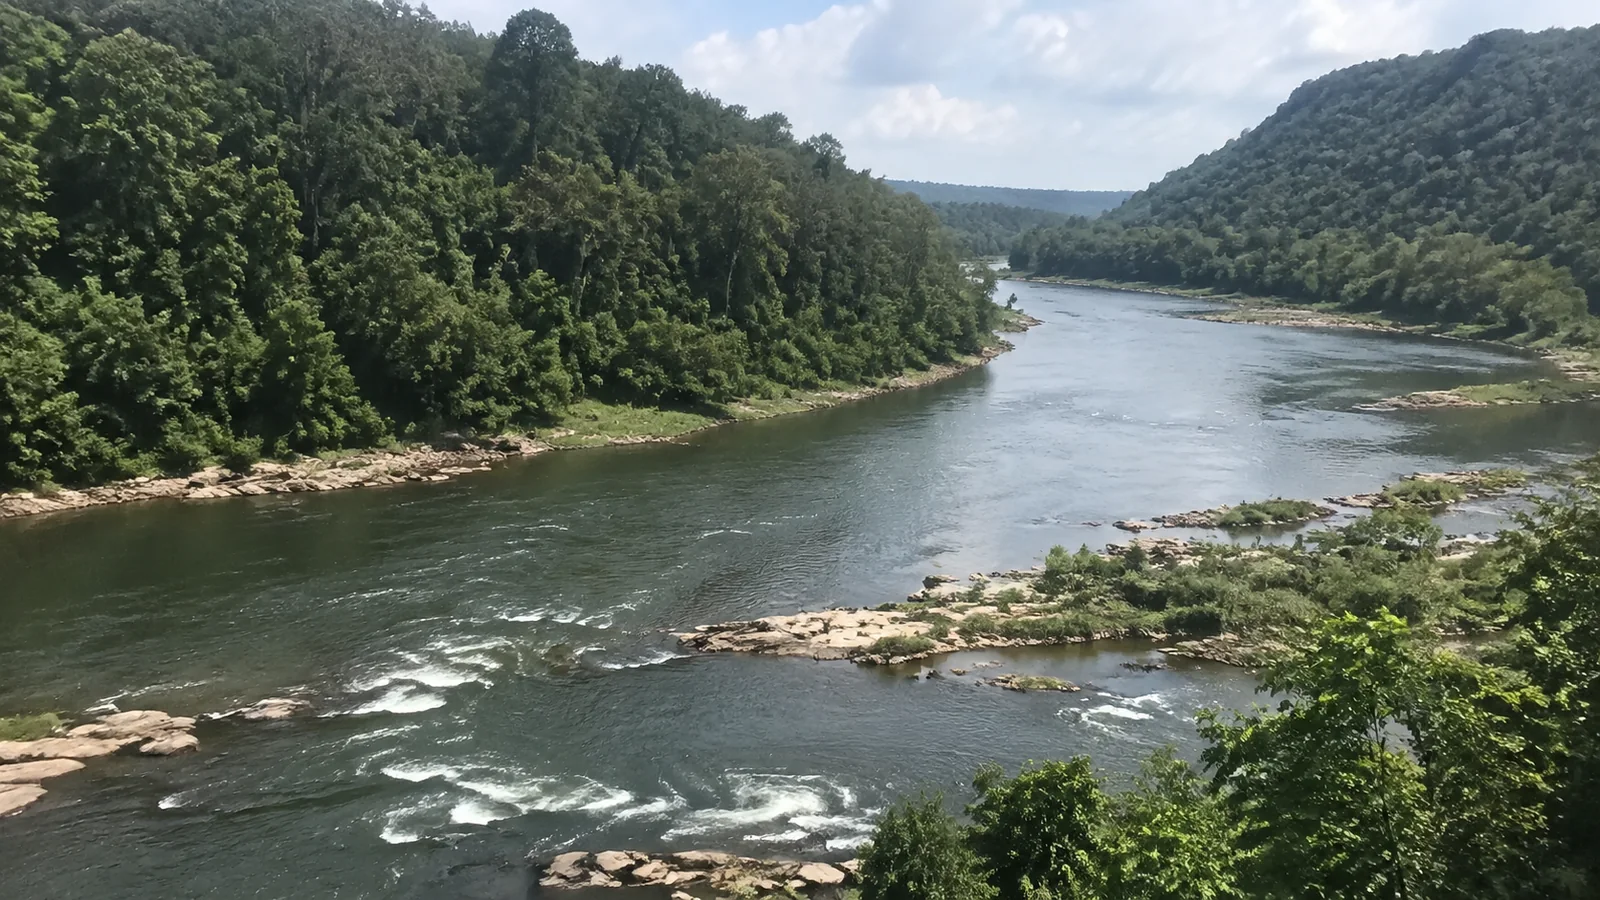
In the EPA’s 2022 National Lakes Assessment, 50% of lakes were rated poor for elevated phosphorus and 47% were rated poor for elevated nitrogen. Excess nutrients can feed algal growth and contribute to low oxygen, ecological damage, recreation closures, and health concerns.
The agency used a statistically selected sample to estimate conditions across eligible lakes in the contiguous United States. Its National Lakes Assessment report is far more informative than assuming every green lake is toxic or every clear lake is clean.
18. A toxin was detected in half of assessed U.S. lakes
Microcystins, toxins produced by certain cyanobacteria, were detected in 50% of lakes in the EPA assessment. Concentrations exceeded the agency’s recreational criterion in 2%, an important distinction between detection and a level above a health-based benchmark.
A waterbody can change quickly with heat, nutrients, and weather. Before swimming, boating, or letting a pet enter unfamiliar freshwater, look for current state, Tribal, or local advisories rather than judging by smell or color.
19. Contamination can accumulate in fish even when water looks beautiful
Every fish-fillet composite tested in the EPA lake study contained detectable mercury and PCBs, and at least one PFAS was detected in 93% of samples. Those results apply to the assessment’s sampled population and do not mean every fish from every American lake is unsafe to eat.
Risk depends on the contaminant level, species, fish size, location, and how often a person eats the fish. Check local fish-consumption advisories, especially for children, pregnant people, and anyone who eats self-caught fish frequently.
20. Clear water is not proof that water is safe
Microbes, lead, arsenic, nitrates, PFAS, and many other contaminants can be invisible, odorless, and tasteless. Cloudiness can signal a problem, but perfect-looking water is not a laboratory result.
The reverse is also true, because harmless minerals or treatment processes can affect appearance or taste. Use official test results and local advisories instead of a social-media demonstration designed to sell a filter.
What these water facts mean for travelers
Travel puts you briefly inside someone else’s water system. Check destination-specific public-health guidance, ask whether tap water and ice are considered safe, and understand that “locals drink it” may not account for a visitor’s exposure or a temporary disruption.
Do not waste water simply because a resort keeps the shower running. At the same time, travelers taking shorter showers cannot repair leaking municipal pipes, regulate industrial discharge, fund sanitation, or settle agricultural water rights.
The sensible approach combines personal care with respect for systems:
- Follow local boil-water, swimming, fishing, and drought advisories.
- Carry a refillable bottle where the refill source is confirmed safe.
- Never assume a portable filter removes viruses, dissolved chemicals, and salt unless its specifications explicitly say so.
- Keep soap, sunscreen, food, and waste out of lakes and streams.
- Use marine-safe waste practices on boats and never throw plastic overboard.
- Support lodging and tour operators that can explain their water, wastewater, and waste systems.
For a broader practical checklist, my collection of travel tips includes ways to reduce waste and treat local resources thoughtfully. My guide to the essential characteristics of ecotourism also helps separate genuine conservation from a leafy logo and a towel-reuse card.

Facts should lead to better questions, not panic
These numbers are disturbing because they describe choices and systems, not an unavoidable law of nature. Safe water, sanitation, treatment, wetland restoration, better irrigation, pollution control, public data, and well-funded utilities are all proven parts of the solution.
The next time a faucet feels ordinary, remember how much engineering, ecosystem health, public investment, and human labor sit behind that glass. Then let the discomfort turn into attention, because water problems become much harder to ignore once you know how carefully “access” and “safe” have to be defined.