Countries Most Affected by Climate Change: What Data Shows
The countries most affected by climate change do not fit into one tidy top-10 list. Dominica, Myanmar, and Honduras lead the latest long-term extreme-weather impact ranking, while places such as Chad, Somalia, and small island nations face a different danger: high exposure paired with far less capacity to prepare and recover.
Which countries are most affected by climate change?
For measured human and economic impacts from extreme weather between 1995 and 2024, the clearest current answer is Dominica, Myanmar, and Honduras. They hold the first three places in Germanwatch’s Climate Risk Index 2026.
That answer needs a big asterisk, because the index looks backward at deaths, people affected, and economic losses from floods, storms, heat waves, drought, wildfires, and other extremes. It does not predict the future or count slow-moving dangers such as sea-level rise.
A country can therefore sit outside that ranking and still be profoundly vulnerable. Low-lying islands, drought-prone countries, and places with fragile health systems may face enormous future risk even if one retrospective list does not place them near the top.
The honest way to answer this search is to look at several kinds of evidence, then explain what each can and cannot tell us. That is what I have done below, without turning real communities into a gloomy countdown.
How climate impact rankings actually work
The latest Climate Risk Index covers 174 countries and combines six indicators. It measures fatalities, people affected, and economic losses in both absolute and relative terms, which stops the largest countries from automatically dominating every result.
The relative measures are especially important for small nations. A hurricane can create a smaller dollar loss than a disaster in a huge economy while still damaging an extraordinary share of a small country’s homes, infrastructure, and annual output.
For a second lens, the University of Notre Dame’s ND-GAIN Country Index evaluates vulnerability and readiness rather than simply adding up past disaster losses. Its indicators consider food, water, health, ecosystems, human habitat, infrastructure, and a country’s ability to turn investment into adaptation.
These tools answer different questions:
- Past impact: Where have extreme weather events already produced the greatest human and economic toll?
- Vulnerability: Where are people and essential systems especially sensitive to climate hazards?
- Readiness: Which countries have the institutions, infrastructure, and resources to adapt?
- Slow-onset risk: Where do rising seas, glacier loss, warming oceans, or long-term drying create mounting pressure?
No single number captures all four. If you see a list naming one country as definitively “most affected” without explaining the metric or dates, it is giving you confidence that the data cannot support.
Countries hit hardest in the long-term extreme-weather record
Germanwatch divides the leaders into two broad stories. Some were pushed high by rare, catastrophic events, while others have endured damaging extremes again and again.
Dominica
Dominica ranks first for 1995 through 2024, and its position shows why percentages matter. A powerful storm striking a small island can affect a vast portion of the population and economy at once, leaving little unaffected territory to support recovery.
Hurricane Maria in 2017 is central to the country’s long-term result, but Dominica should not be reduced to one disaster. Its steep terrain, exposed infrastructure, and hurricane risk make resilience a continuing national project.
Myanmar
Myanmar ranks second, with Cyclone Nargis in 2008 standing out as an exceptionally deadly event. Flooding, storms, landslides, heat, and coastal exposure interact with poverty and political instability, making preparation and recovery much harder for many communities.
This is also a reminder that a national rank can hide huge differences inside a country. A delta community, a dense city neighborhood, and a mountain village do not share the same hazards or options.
Honduras
Honduras ranks third in the long-term index. Hurricane Mitch in 1998 was unusually destructive, while later storms, floods, drought, and crop stress have kept climate risk painfully relevant.
The effects do not end when floodwater disappears. Damaged roads, lost harvests, interrupted school, displacement, and household debt can extend the cost for years.
Libya
Libya’s place among the hardest-hit countries is strongly shaped by the catastrophic 2023 flooding in Derna. Extreme rainfall became far more deadly when dams failed, which shows why climate hazards must be understood alongside maintenance, governance, land use, and warning systems.
Climate change does not operate in a vacuum. The same physical hazard can produce very different outcomes depending on where people live and whether protective systems work.
Haiti
Haiti appears in the recurring-extremes group rather than because of only one standout event. Hurricanes, floods, and drought meet deforestation, fragile infrastructure, poverty, and limited public capacity, creating layers of risk that are terribly difficult to untangle.
It is easy for an outsider to write “natural disaster,” but the disaster is never purely natural. Exposure and the ability to recover decide a great deal of the human toll.
The Philippines
The Philippines faces tropical cyclones, flooding, landslides, extreme heat, and rising coastal risk across more than 7,000 islands. Its long-term index position reflects repeated events, not one isolated bad season.
The country also shows why national averages feel incomplete. Risk varies dramatically between a well-served urban district and an exposed coastal or mountain community.
Nicaragua
Nicaragua is another country repeatedly affected by storms, flooding, and drought. Caribbean hurricanes can damage homes and roads, while shifting rainfall and heat can pressure farming and water supplies elsewhere.
Repeated losses are exhausting even when each event fails to dominate international headlines. Households may have to rebuild before savings, crops, and local services have recovered from the previous shock.
India
India combines a vast exposed population with major regional differences. Heat waves, intense rainfall, floods, drought, cyclones, glacier change, and coastal risk all matter, but not in the same places or seasons.
The scale is part of the story, yet the most useful questions remain local. Housing quality, access to cooling, drainage, work conditions, and early warnings shape who is actually safe.
Grenada, the Bahamas, and other small island states
Grenada and the Bahamas both appear among the long-term index’s hardest-hit countries, and the 2024 ranking placed Saint Vincent and the Grenadines first and Grenada second. Hurricane Beryl’s impacts are a sharp example of how one season can reverberate through housing, tourism, agriculture, power, and public finances.
Small islands also face a threat that this particular index excludes: gradual sea-level rise. NASA’s IPCC-based sea-level projection tool is useful because local projections differ and a single global number cannot describe every shoreline.
Countries where vulnerability and low readiness deepen the danger
Chad, Somalia, the Central African Republic, and Eritrea sit near the most vulnerable, least-ready end of current ND-GAIN data. That does not mean every person there faces the same outcome, but it does flag serious pressure across basic systems.
In this group, climate risk often arrives through food and water insecurity, extreme heat, drought, flooding, disease exposure, and livelihoods tied closely to rain-fed agriculture. Conflict, displacement, debt, and limited infrastructure can further narrow the choices available before and after a shock.
Chad
Chad was third in the Climate Risk Index’s 2024 results as well as highly vulnerable in adaptation data. Flooding can displace families and damage crops, while heat and water stress remain persistent concerns across a country with very limited capacity to absorb losses.
Somalia
Somalia can swing between punishing drought and destructive floods, both of which threaten food, water, health, and pastoral livelihoods. A weather event becomes much more dangerous when families are already displaced or coping with conflict and limited services.
Central African Republic
The Central African Republic illustrates the readiness side of the equation. Limited roads, health capacity, finance, weather observations, and institutional reach can make it difficult to convert an accurate risk warning into protection on the ground.
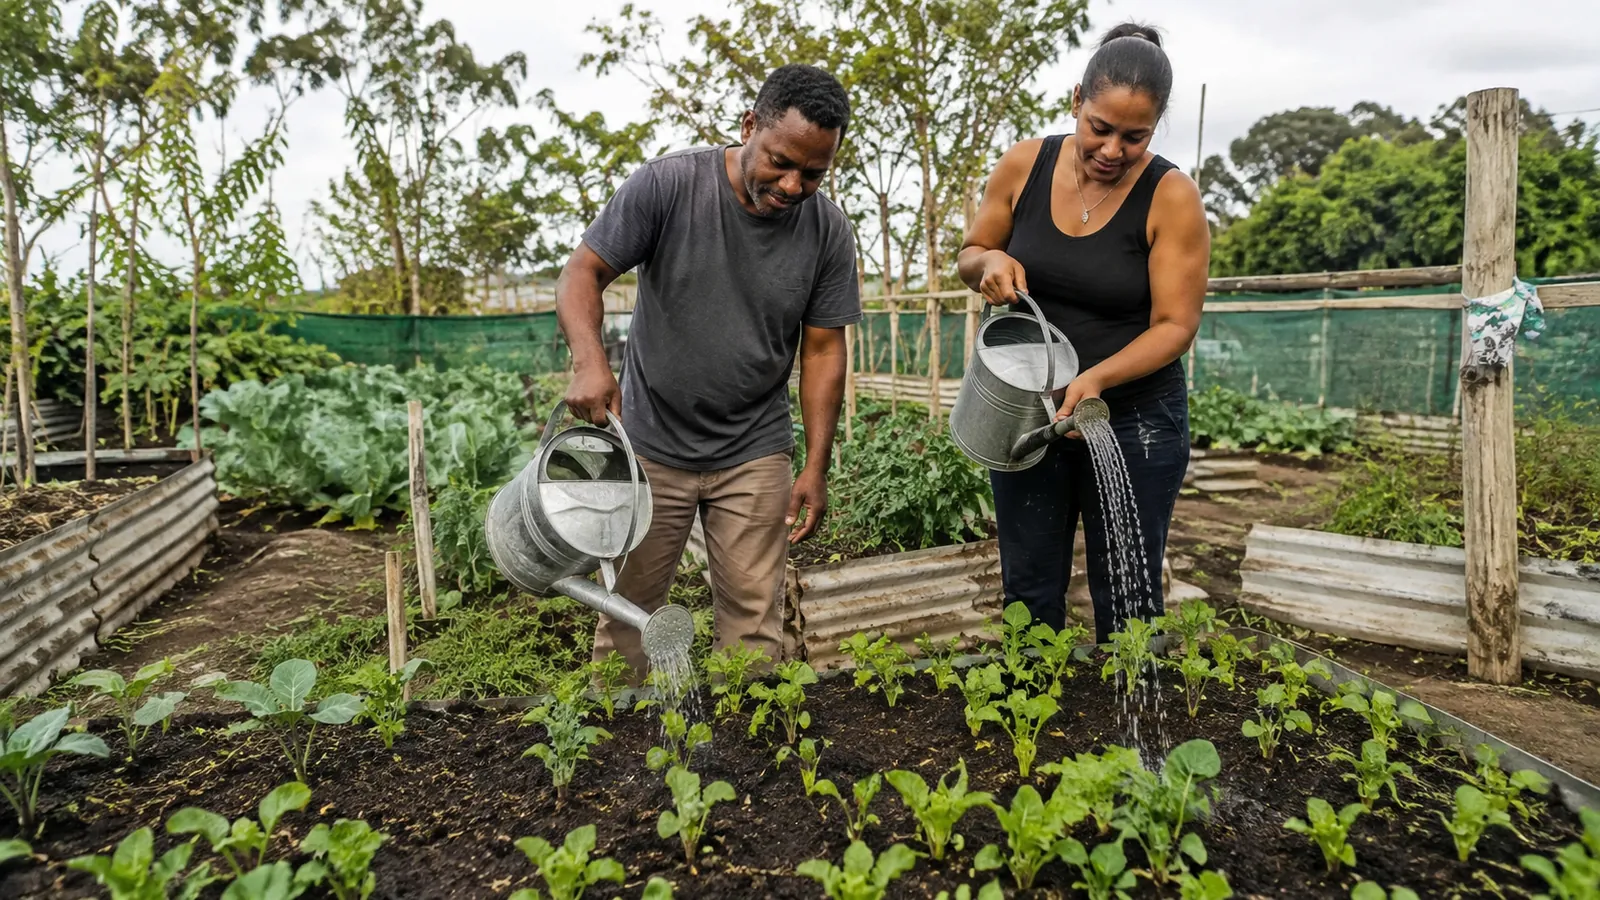
That is why climate adaptation is not just a seawall or a drought-resistant seed. It also includes trusted warnings, clinics, reliable power, schools, roads, insurance, public finance, and institutions capable of reaching the people at greatest risk.
Why Pakistan and Asia belong in this conversation
Pakistan is not in the latest 30-year Climate Risk Index top three, but it is impossible to discuss current climate impacts without it. The World Meteorological Organization’s State of the Climate in Asia 2025 reports that monsoon flooding in Pakistan was associated with more than 1,000 deaths and left over 3 million people needing assistance.
The same WMO report documents devastating flooding in Sri Lanka and Vietnam, severe drought in parts of West Asia, and mass loss across all 23 monitored glaciers in High-mountain Asia. These are different hazards tied together by a warming climate and enormous human exposure.
Across Asia, a hotter atmosphere and ocean do not produce one uniform future. Some places face heavier downpours, others deeper water stress, and many face both at different times.
Climate change affects wealthy countries too
Wildfire, flood, heat, drought, and coastal damage do not stop at an income threshold. The United States, Canada, Australia, Japan, and European countries all experience serious losses, and wealthy communities can still be devastated.
The difference is often capacity, not immunity. Stronger buildings, insurance, health care, forecasts, emergency response, savings, and public finance can prevent a hazard from becoming an equally severe humanitarian crisis.
Even those advantages are unevenly distributed. Low-income households, outdoor workers, older adults, disabled people, renters, migrants, and communities with a history of underinvestment can face much greater danger inside a rich country.
The WMO’s State of the Global Climate 2025 confirms that 2015 through 2025 were the hottest 11 years on record. It also reports that intense heat, heavy rainfall, and tropical cyclones affected millions and cost billions around the world.
What the rankings leave out
Every climate list is built from imperfect data. Germanwatch openly notes that extreme events and their impacts are often underreported, especially in Global South countries, so a lower position should never be mistaken for safety.
National rankings also flatten local inequality. Two families in the same city may have completely different exposure depending on housing, income, health, transportation, tree cover, drainage, and whether they can leave work during a warning.
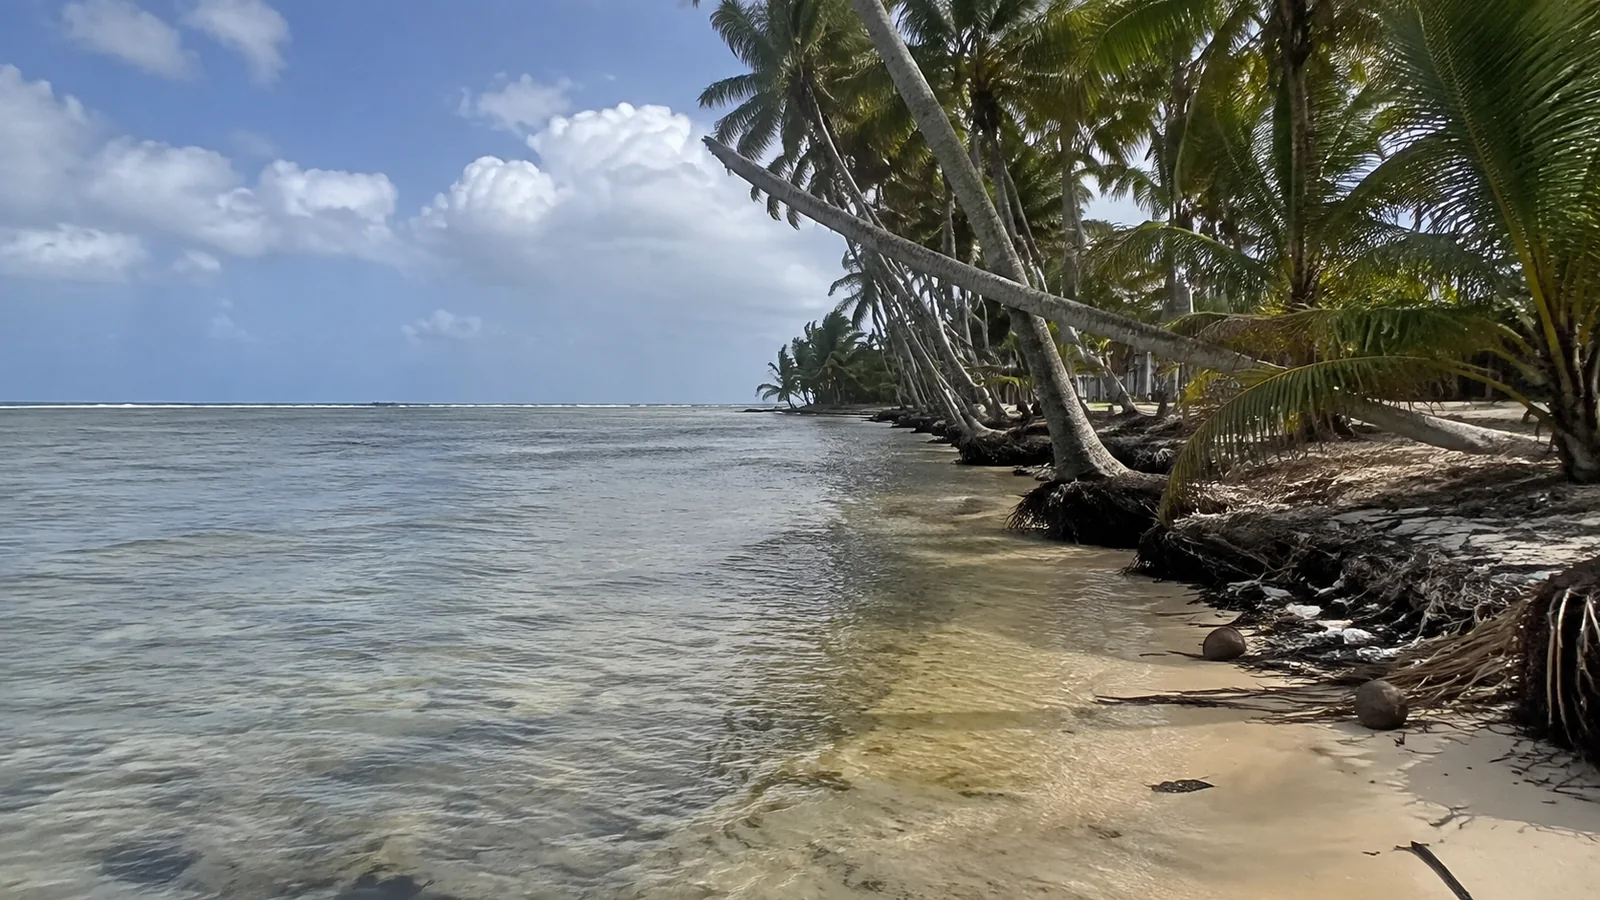
Slow changes can be missed as well. Saltwater intrusion, coastal erosion, ocean acidification, glacier retreat, and gradual shifts in growing conditions may transform livelihoods without appearing as a single disaster entry.
Finally, a climate-influenced event is not evidence that climate change single-handedly “caused” every storm, fire, or flood. Attribution science asks whether human-caused warming changed an event’s likelihood or intensity, while local conditions help determine the damage.
How travelers can respond without turning places into spectacles
“Last-chance tourism” is a terrible reason to rush into a vulnerable place. Communities are homes, not vanishing exhibits, and disaster recovery is not entertainment.
Before a trip, check seasonal hazards, official warnings, insurance exclusions, and whether your visit would strain water, housing, transportation, or emergency services. A destination can be open to visitors while one neighborhood is still rebuilding, so local context matters more than a dramatic headline.
Spend with locally owned lodging, guides, restaurants, and shops when practical, then follow water and energy requests without grumbling. My guide to the essential characteristics of ecotourism explains why community benefit and conservation matter more than a green label.
If you are dreaming about island travel, approach it with curiosity rather than doom. The planning ideas in my South Sea cruise overview and guide to Asian countries worth visiting can help you think regionally without pretending every destination faces the same pressures.
Travel emissions still count, so fewer, longer trips are often more sensible than a string of rushed getaways. Direct flights when feasible, lighter luggage, trains for workable routes, and credible climate contributions can be parts of a plan, but none erases the need to reduce emissions overall.
Frequently asked questions
What country is most affected by climate change?
Dominica ranks first in the latest long-term Climate Risk Index, which measures realized extreme-weather impacts from 1995 through 2024. It is not a universal ranking of every present and future climate threat.
Why do small island countries rank so high?
A single storm can affect a large share of a small nation’s people, land, infrastructure, and economy. Islands may also face sea-level rise and coastal erosion that a sudden-disaster index does not measure.
Which regions are most vulnerable?
Small island states, parts of sub-Saharan Africa, South and Southeast Asia, and fragile or conflict-affected countries carry especially serious risks. Vulnerability still varies enormously within each region, so broad labels should be a starting point rather than a verdict.
Are the countries producing the most emissions also the most affected?
Not necessarily. Many countries with small historical contributions to global emissions face severe losses because they are highly exposed and have fewer resources for adaptation and recovery.
Will the ranking stay the same?
No. Annual rankings can change sharply after one major event, and long-term rankings shift as new years enter the record, methods improve, or missing data is added.
The clearest takeaway
Dominica, Myanmar, and Honduras have endured the heaviest measured extreme-weather impacts in the latest 30-year ranking, while Haiti, the Philippines, Nicaragua, India, and several small islands show the burden of repeated events. Chad, Somalia, and other low-readiness countries remind us that the next disaster’s consequences depend heavily on resources and institutions already in place.
The useful question is not simply who is number one. It is which hazards a community faces, who is most exposed, what protection exists, and whether the people carrying the greatest burden have the money and power to shape the response.